Darca Heritage V2 Tour
View Data Window
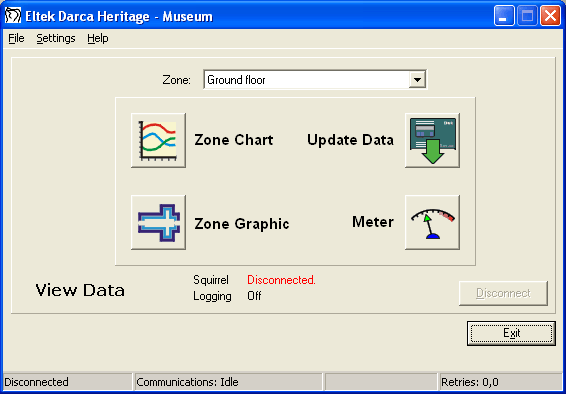
The View Data window appears once the program has been launched. From here, the most commonly used features of the program can be accessed:
- View graphed data (Zone Chart)
- View a snapshot of current data in graphical or numerical form (Zone Graphic or Meter)
- Manually retrieve new data from the data logger (Update Data)

Zone Graphic Window
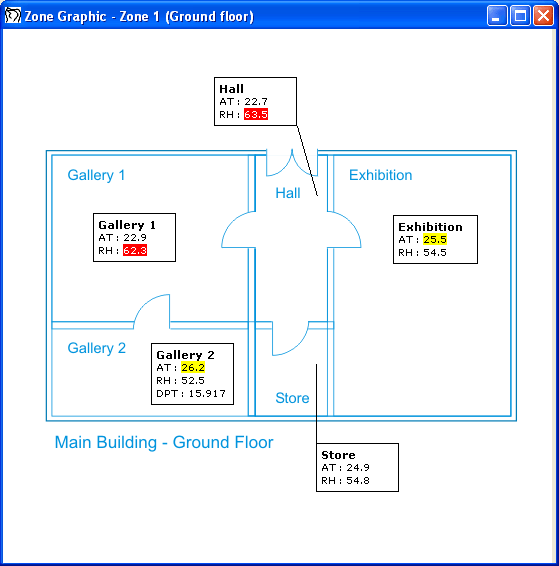
The Zone Graphic Window displays the current readings for each group of transmitters in a zone. Darca Heritage divides a site into zones (in this example the zone is the first floor of a building), each of which contains groups of transmitters (in this example each group represents a room on the first floor). This makes it easy to split a large site into manageable chunks for analysis.
- Import architectural floor plans: The Zone Graphic uses standard Windows bitmap files. Groups can be physically positioned on the graphic during the site setup process.
- Colour coded safe limits: Readings outside safe limits are highlighted in yellow (a warning) or red (an alarm).
- Compare internal and external: Include externally located transmitters in the same group as internally located transmitters for a quick comparison.
- View physical and calculated channels: The group "Master Bedroom" contains the physically measured parameters RH and AT alongside calculated parameter DPT (dew point temperature).
- Open multiple zone graphics: All the zones in the site can be viewed simultaneously by positioning the zone graphic windows adjacent to each other on your screen.

Meter Window
The Meter Window shows current data values in a grid to save space.
- The Site Administrator can view the entire site at once: With all zones selected, the entire site's values are displayed on the screen for a quick summary of alarm levels.
- Departmental Administrators and Users can view all zones in a department simultaneously.
- Colour coded safe limits: Readings outside safe limits are highlighted in yellow (a warning) or red (an alarm).

Zone Chart Window
Introduction
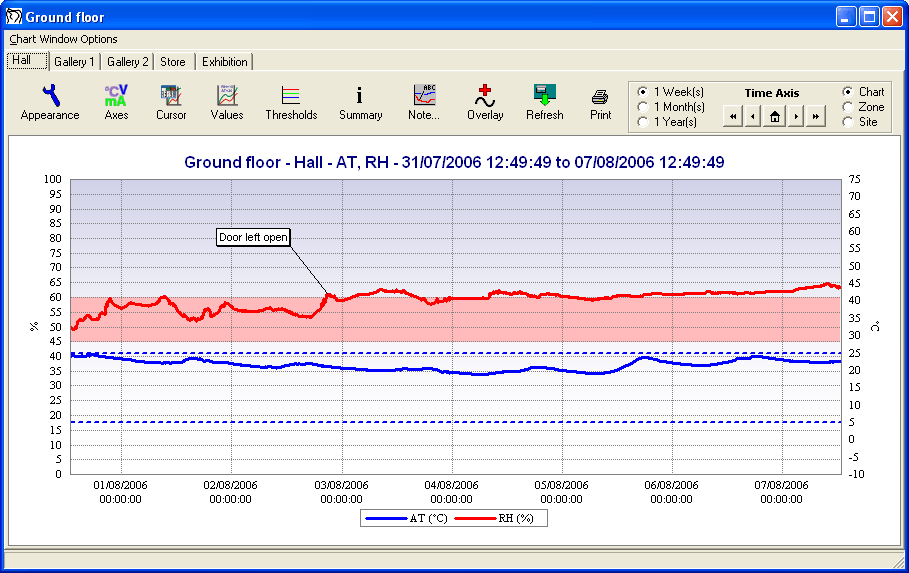
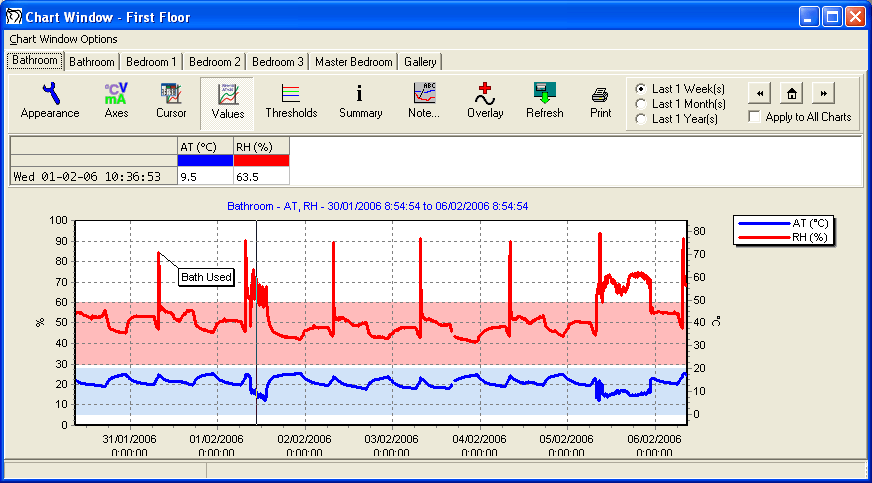
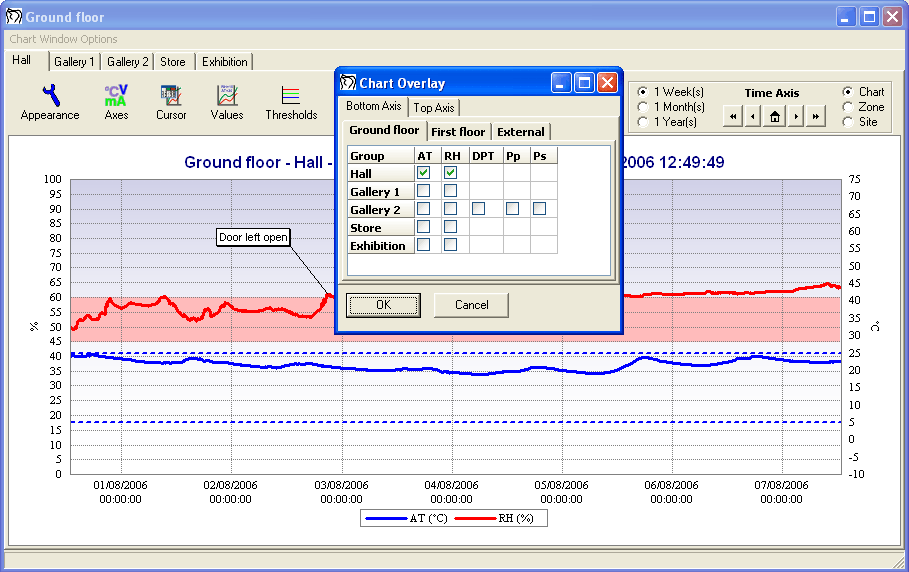
The Chart Window shows graphed data for every group in the chosen zone and is divided into tabs for fast access. A group may be split over several tabs if it contains many different parameters - in the example above, temperature and humidity are shown on one graph; any light channels in the group would be displayed on another graph.

- "What If?" graphs: To simulate the effect of altering overall temperature, e.g. by increasing a thermostat level by 10 degrees, a "What If?" parameter can be set up. This parameter will plot the measured air temperature + 10 degrees, showing the resulting effect on parameters such as dew point temperature and absolute humidity.
- Cumulative light graph: In addition to standard formulae such as AH and DPT, calculated parameters can be set up to display data for a particular channel as a cumulative plot. This is especially useful when viewing light channels where the total length of exposure time is important.
- Overlay channels: Channels from any group in the site can be overlaid on the current graph for comparative analysis. Channels can also be overlaid on the top axis of the graph in order to compare data from two different time periods, e.g. RH and AT for October plotted alongside RH and AT for November.
- Export graph to image file: A JPEG or Bitmap file of the graph can be created in order to store or send the graph in a format which is accessible to users without the software.
- Upload graphs to the internet: Exported graph images can be automatically uploaded to the internet when new data is received. The latest graphs can then be viewed anywhere in the world.
- Alarm plot style: Alarm levels can be plotted as colour blocks (as on the example above) or simple dotted lines.
- Alter graph appearance: Every aspect of the graph appearance, including colours, legend, title, axes and gridlines can be completely customised to suit a particular style.
- Time Selector: Flip quickly between the last week, month or year's worth of data with the time selector tool.
- Zoom and Pan: Animated zoom on the graph with the left mouse button, pan the graph with the right mouse button.
Cursor Tools
Readings at cursor
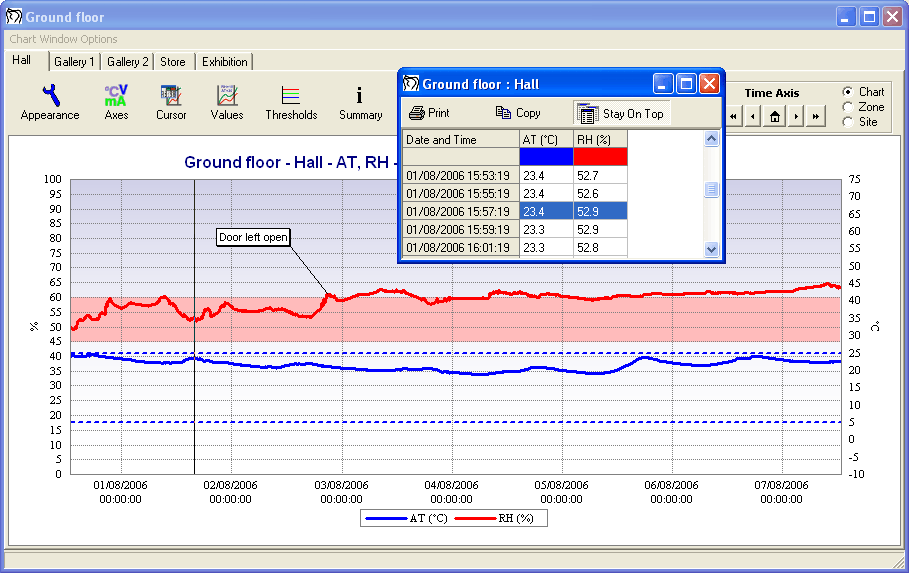
The cursor tool displays numeric data for a clicked point on the graph:

Values cursor
The values cursor tool displays numeric data for a point on the graph. The cursor can be freely moved around the graph with the mouse and values will instantly update:

Summary Window
Summary window
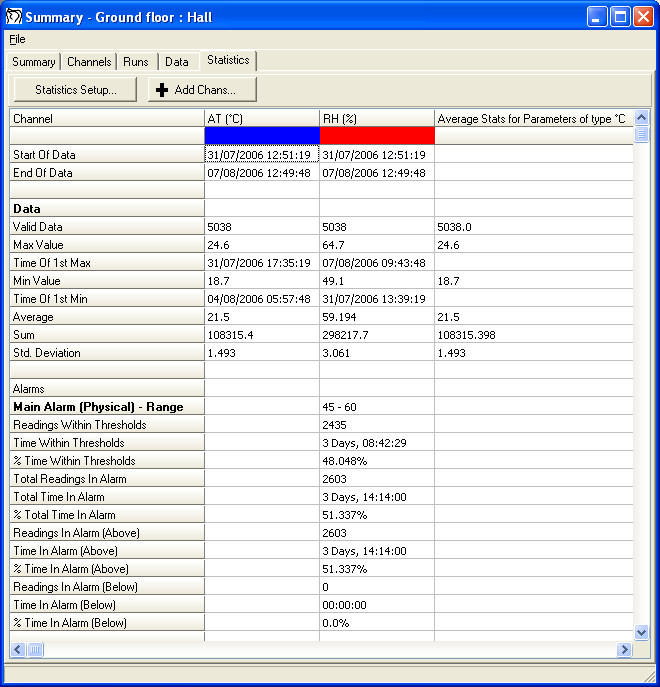
The statistics tab of the summary window shows a variety of statistics about each channel on the graph. As well as the standard statistics shown above, information about how long each channel has been in each of its alarm states is available. The data tab displays the data points from the graph in numeric form, and extra channels can be added to this and the statistics tab in the style of the graph "Overlay" feature. All information in this window can be exported as text or printed for reference.

Notes Tool
Notes tool
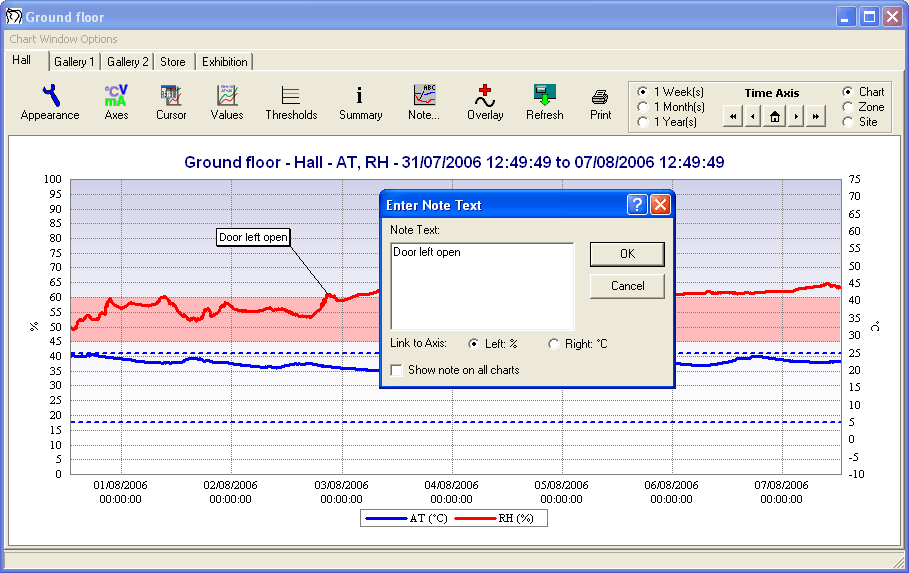
To annotate the graph with meaningful text notes, the note tool can be used. Notes are saved permanently for future use when the graph window is closed.
- Add notes to either the current graph or all graphs in the site.
- 'View All Notes' window displays a table of all notes in the site and contains tools for printing and copying the notes.

Overlay
Overlay channels: Channels from any group in the site can be overlaid on the current graph for comparative analysis.
Top Axis Overlay: Channels can also be overlaid on the top axis of the graph in order to compare data from two different time periods, e.g. RH and AT for October plotted alongside RH and AT for November.

Report
To prepare the graphs for printing, or to preserve current graphs for future views, the report window feature is used.
- Graphs can either be drawn sequentially across the pages, or tick boxes can be used to specify which charts are on each page.
- Reports can be saved or printed to PDF for easy viewing across a network.
- When opened at a later date, reports are still ‘live’, i.e. all aspects of the chart appearance can still be customised, including which channels are on the graphs.
- ‘Create Multi Period Report’ feature: Choose some channels to display and create, e.g. 12 charts, one for each month of the year. The time period and number of charts can be chosen.
- Report Templates can be saved for report appearance settings that will apply to all reports (e.g. user’s company name in the header or footer).

Site Settings
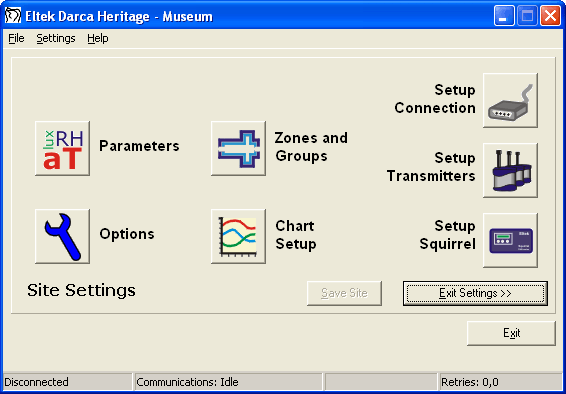
The Site Settings window gives the site administrator easy access to the various configuration tools.
- Parameters and Zones and Groups: Specify what will be measured and how the sensors are physically positioned in the site.
- Options: Specify how the program retrieves and manages data and backs it up.
- Setup Squirrel and Setup Transmitters: Eltek's GenII telemetry system allows full configuration of the Squirrel and transmitters from the PC to save time.

Parameters
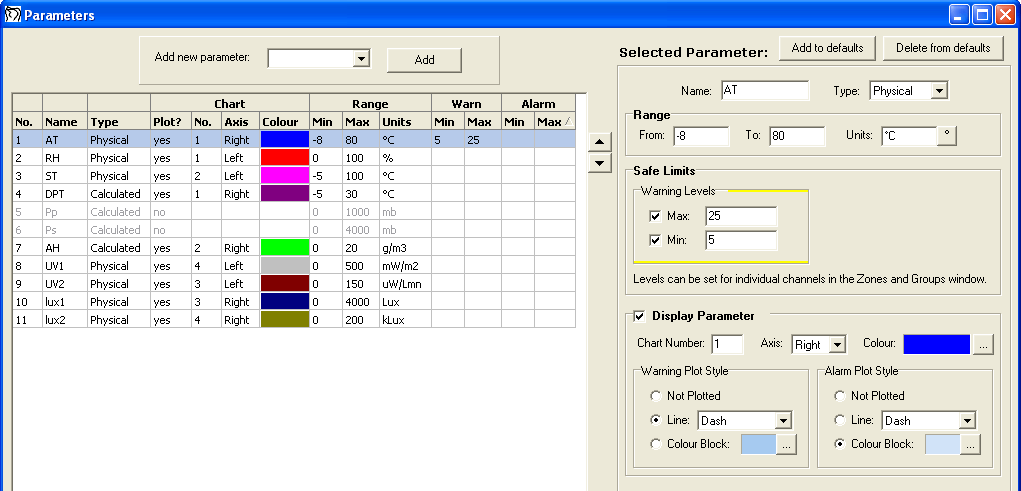
The Parameters window allows the site administrator to specify what is being measured throughout the site.
- Physical parameters are measured with sensors, whereas Calculated parameters use mathematical formulae to manipulate the data from physical parameters.
- Specify which parameters appear together on a graph.
- Set two levels of Safe Limits - Warning levels or Alarm levels - and how these appear on graphs.
- Wizard for first time users - simplifies the process of setting up parameters by using simple tick boxes.

Zones / Groups
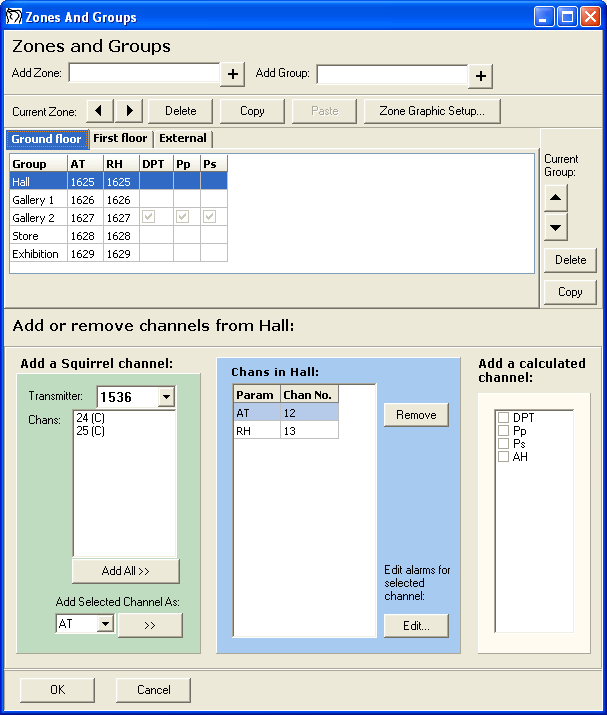
The Zones and Groups window allows the site administrator to specify how the transmitters are physically positioned throughout the site.
- Add Transmitter To Group button to save time when adding multiple channels from the same transmitter to a group.
- Channel specific alarms for channels that require their own unique Warning and Main alarm levels.
