Darca Plus - Download and analysis software
Key features:
- All operational control of the Squirrel may be performed using the PC
- Data can be exported into text format for analysis in a spreadsheet package
- Squirrel channels may be scaled into appropriate engineering units
- Alarm feature warns if any channel inputs are outside "‘safe" limits
- Squirrel configuration may be saved as a Setup File and then applied to other Squirrels
- Displays all selected channels on screen simultaneously
- Contact Wizard guides you through the stages of contacting the Squirrel
- "Shed" utility allows scheduled, automated downloading of data from the Squirrel
- Transmitter setup for the Gen II Telemetry System
- Powerful graphing tools display real-time or historical data: 3D plots, line, event and windrose
- Plot colour and axis configuration can be saved
- Text comments can be added to points of interest on a graph
- Summary window displays data and statistical information
Darca Plus Tour
The Main Window
This presents the four main options in a clear large button format:

- Export Data - export a datafile for viewing within a spreadsheet, such as Excel
- Graph Data - view a graph and statistics of a Squirrel datafile
- Preferences - configure Darca options
- Contact Wizard - contact a Squirrel connected to your PC or via a modem
The Contact Window of Darca Plus appears when a Squirrel has been contacted. The status bar at the bottom displays the current communication status of the Squirrel. The Status Window then appears and shows you exactly how the Squirrel is configured and operating.
The VCR-style buttons in the centre provide control for Starting / Stopping logging and Clearing the memory in the Squirrel. Once the Squirrel contains data it can be downloaded onto the PC with the Download Runs button. Data is stored as a binary datafile which can then be exported for viewing in a spreadsheet or graphed using Darca Plus's Graphing tool.
The following options are available on the Contact Window:
- Download Runs - Download the data from the Squirrel onto your PC. Data is divided into 'runs', each of which spans a particular period of time.
- Meter Channels - View the current values of the Squirrel's inputs in meter form or graph form.
- Squirrel Settings - Configure how you wish the Squirrel to operate (e.g. logging times and dates, logging and memory modes).
- Channel Setup - Configure which input channels you wish to use on the Squirrel and the ranges of those inputs.
The Squirrel Settings Window
This provides complete operational control of the Squirrel's general settings:

- Using the Squirrel Settings and Channel Setup Windows enables you to avoid using the buttons on the logger itself.This is especially useful for sites where the datalogger is hard to reach.
- The four tabs provide access to the various areas of Squirrel configuration.
- Squirrel configuration may be saved as a Setup File and then applied to other Squirrels
- Delay Generator and Memory Size Calculator tools assist in setting the Start and Stop time.
The Channel Setup Window
This provides an easy to use interface for configuring how the input channels on the Squirrel should be used:

- Channels can be turned on or off to control whether they appear in the meter window and are logged.
- The range and input of each channel can be chosen in the Edit Channel dialog or simply copied from another channel with the copy and paste tools.
- Squirrel configuration may be saved as a Setup File and then applied to other Squirrels.
Metering tools
The bar/needle:

- The bar/needle window (top) provides a clear instantaneous representation of the Squirrel's input channels:
Channels in alarm are displayed in red.
Channels in the window may be grouped to reflect the physical location of input sensors.
The real time graph:

- The real time graph gives a time-span representation and updates constantly.
3 view modes are available: Paged view, Scrolling view or a Full time-span view.
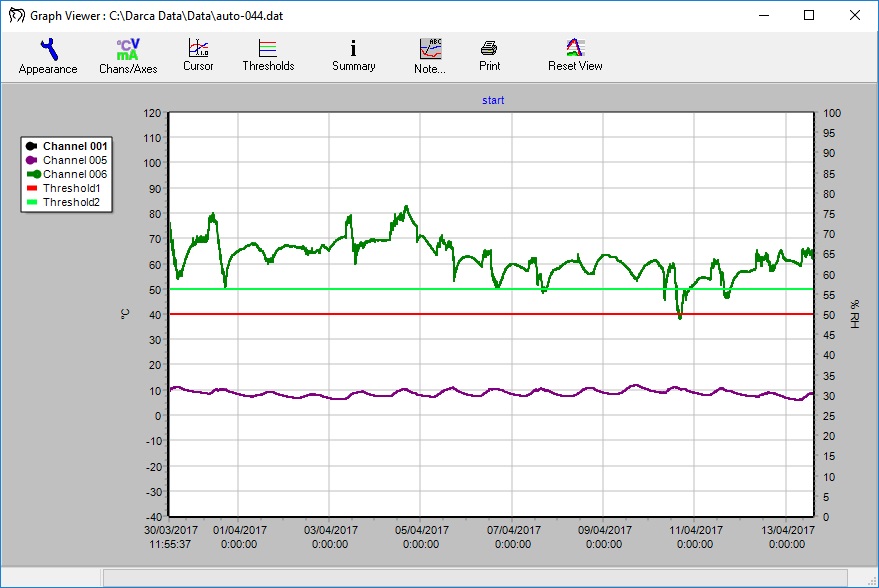
The graphing window
Darca Plus's sophisticated graphing window allows you to view your data quickly and easily, whilst at the same time having complete control over which channels are displayed and how. Features such as graph thresholds, graph cursors and graph notes contribute to this powerful data analysis tool.
Key Features:
- Continuous and event inputs displayed one above the other
- 3D plots
- Animated zooming
- Plot colour and axis configuration may be saved
- Text comments can be added to points of interest
- Real time graphing of metered data
Features in detail:
- The appearance of the Graph Window, legend, gridlines and 3D orientation can be controlled with the Settings Window.
- The Graph Cursor allows you to view the raw data of a point on the graph by clicking on it with the mouse.
- Use the Graph Summary Window to view information about the Squirrel and its data, as well as the raw data itself and a statistical analysis of it.
- Plot channel thresholds on the graph with the Graph Thresholds tool. These will then be included in the statistical analysis.
The Graph Summary Window is available by clicking the Summary button on the graph toolbar. It provides numerical information about the data:

The five tabs display the following information:
- Summary - includes information about the Squirrel, the number of channels in the datafile and the logging mode
- Channels - information about each channel's input type, range and units
- Runs - the Start Time, Stop Time, Run Size and Logging Interval of each run
- Data - the data itself in numerical form
- Statistics - various useful statistics calculated from the data (as shown above)
Documentation
Darca Plus Datasheet
Darca Plus Manual
